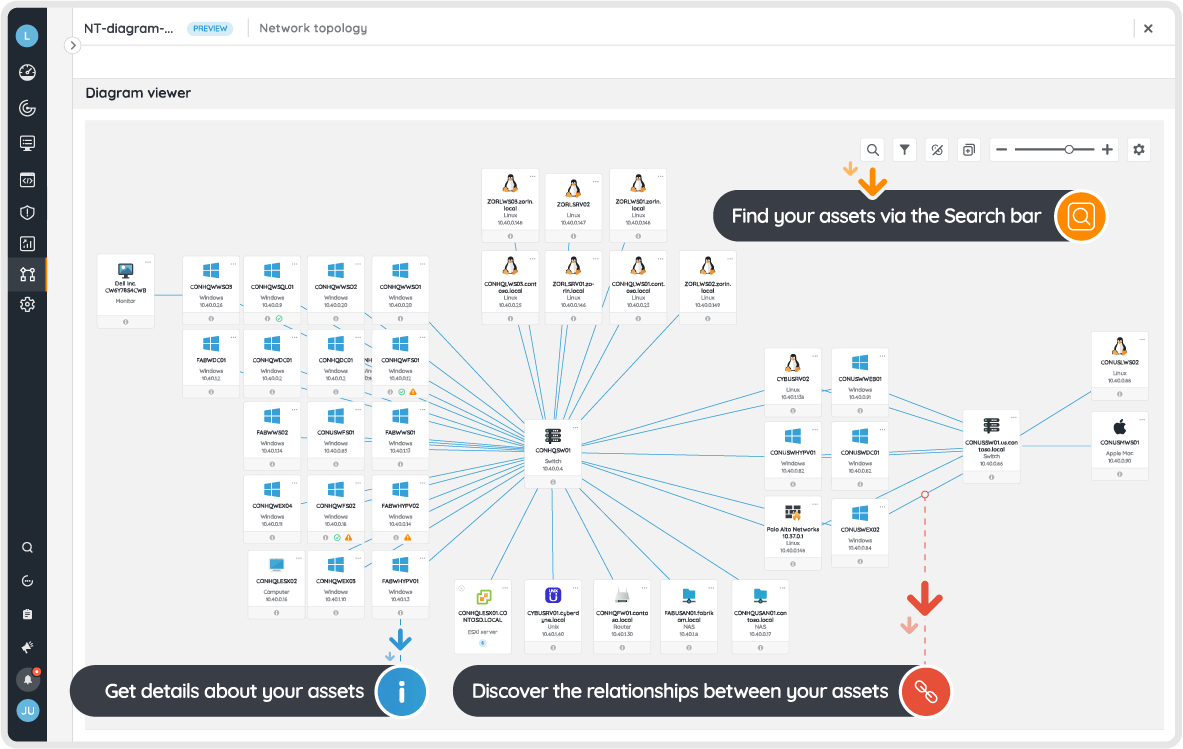
NETWORK DIAGRAMS
Visualize your network topology and virtual environments with Lansweeper’s dynamically generated Diagrams. Lansweeper collects detailed IT asset data from all IT, OT, and IoT devices that make up your IT estate. Customizable and dynamic diagrams let you go to work with that data by allowing you to oversee your entire network, its connections, dependencies, and more at a glance.


Trusted by


We build our platform with IT Professionals in mind to give you granular visibility across your IT, OT, and IoT estate.
Get complete visibility in one single easy-to-use solution with with Lansweeper’s advanced IT discovery.
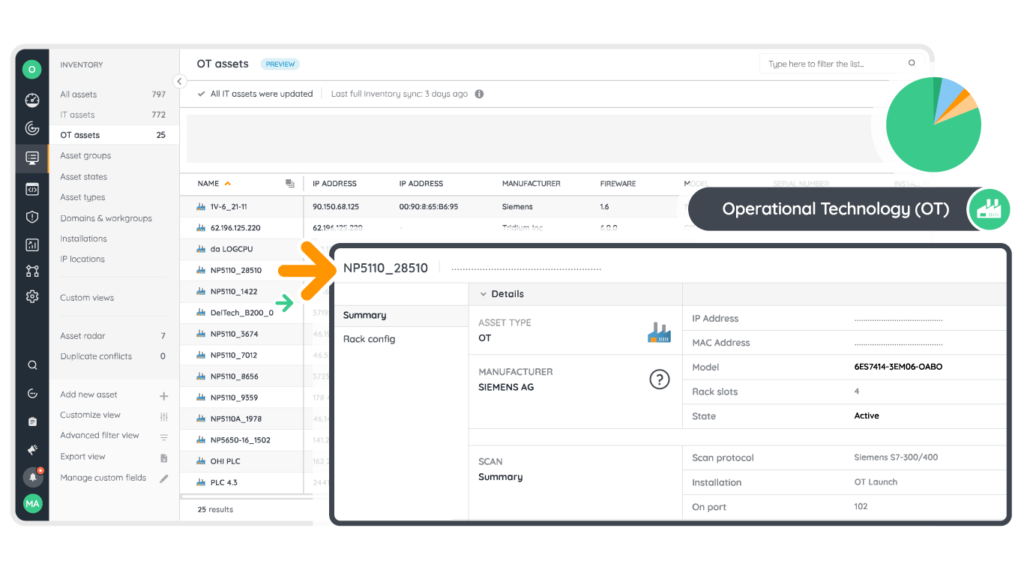
OT discovery brings your OT and IT estate together under a single pane of glass.
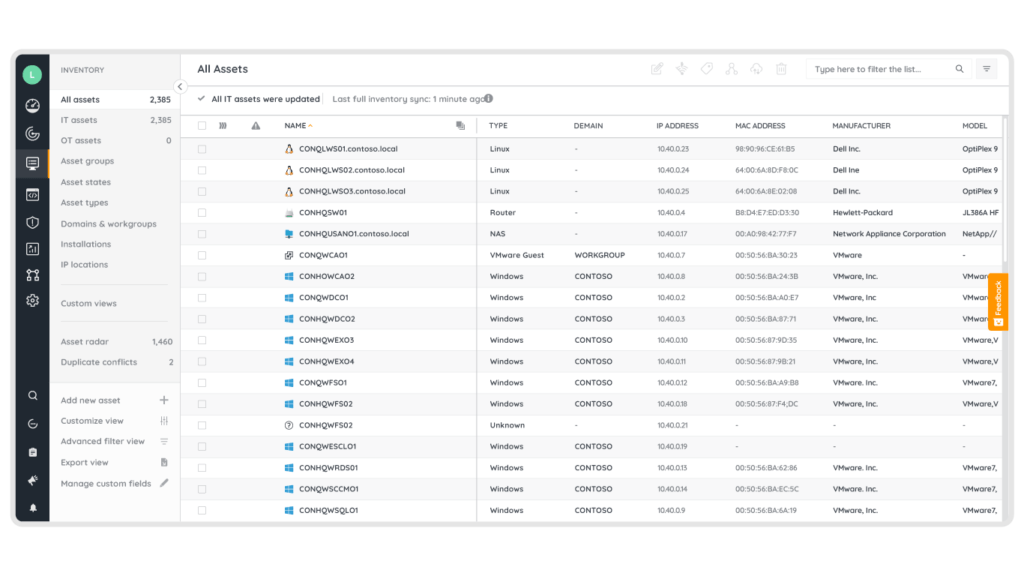
Consolidate and normalize all asset data in one centralized inventory.
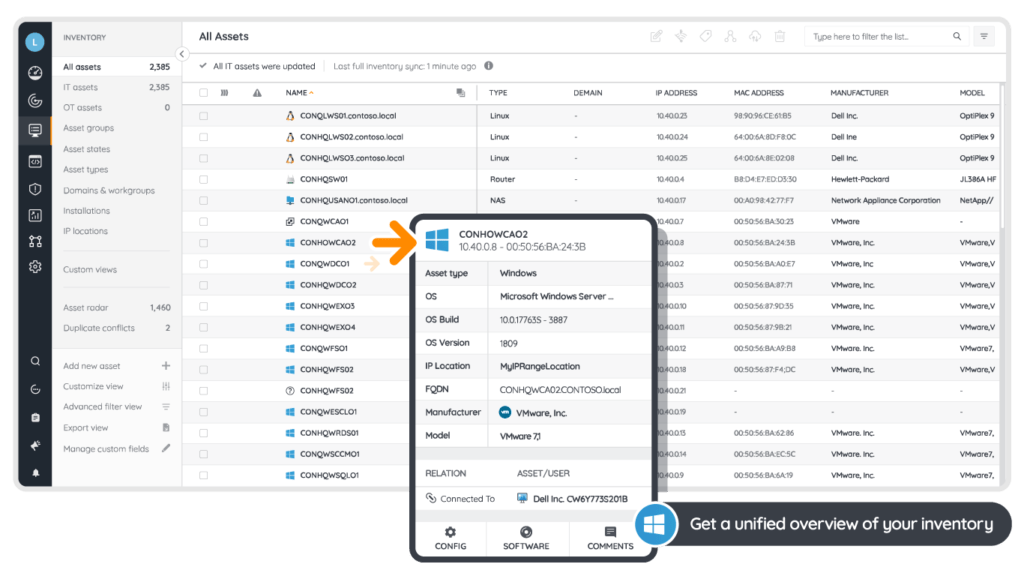
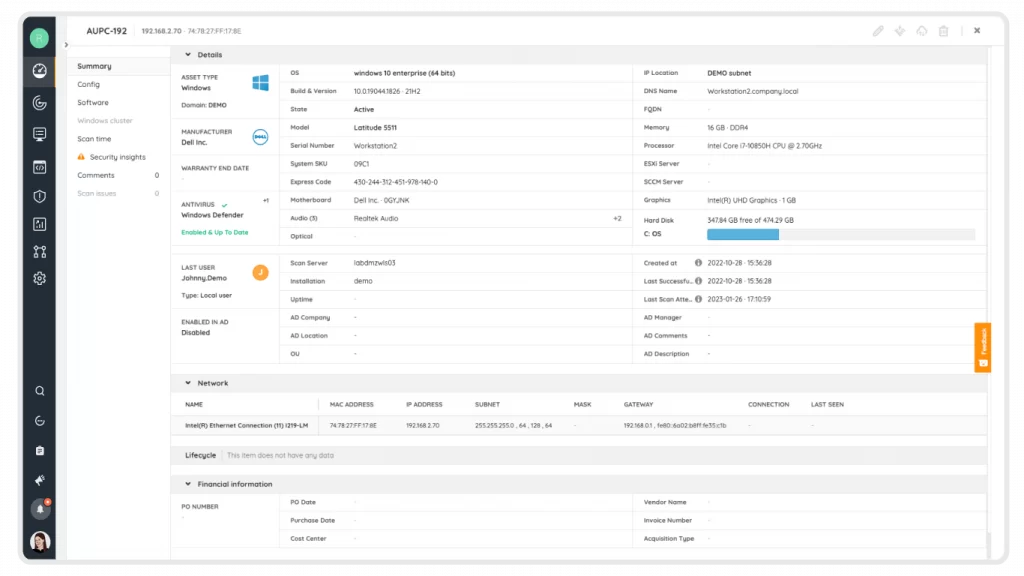
Identify and assess details to actively manage your technology assets. Find assets with specific traits and dive deeper into their hardware, software, and user details.
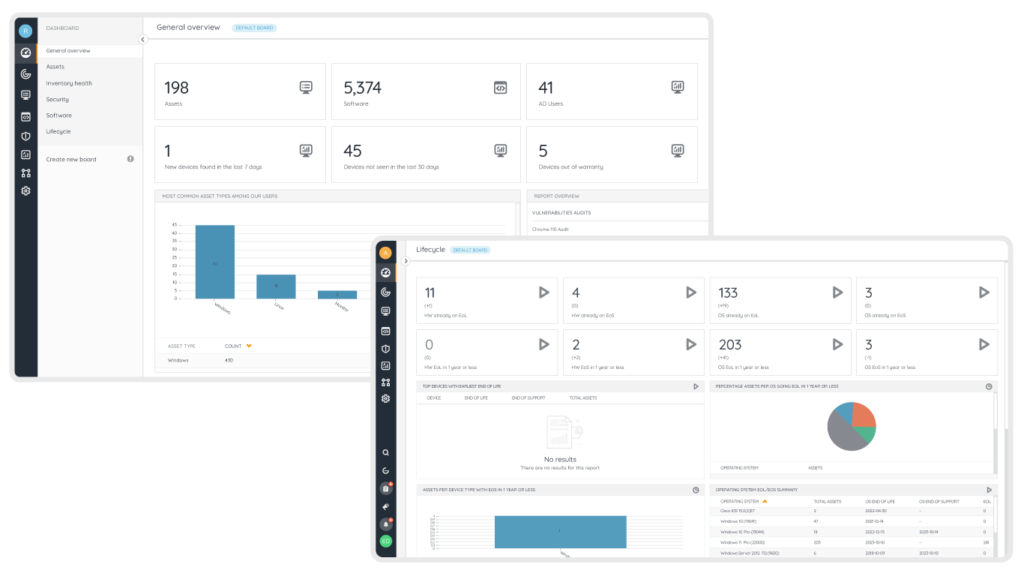
Consult top-down dashboards to supervise your technology estate and drill down into the details when needed.
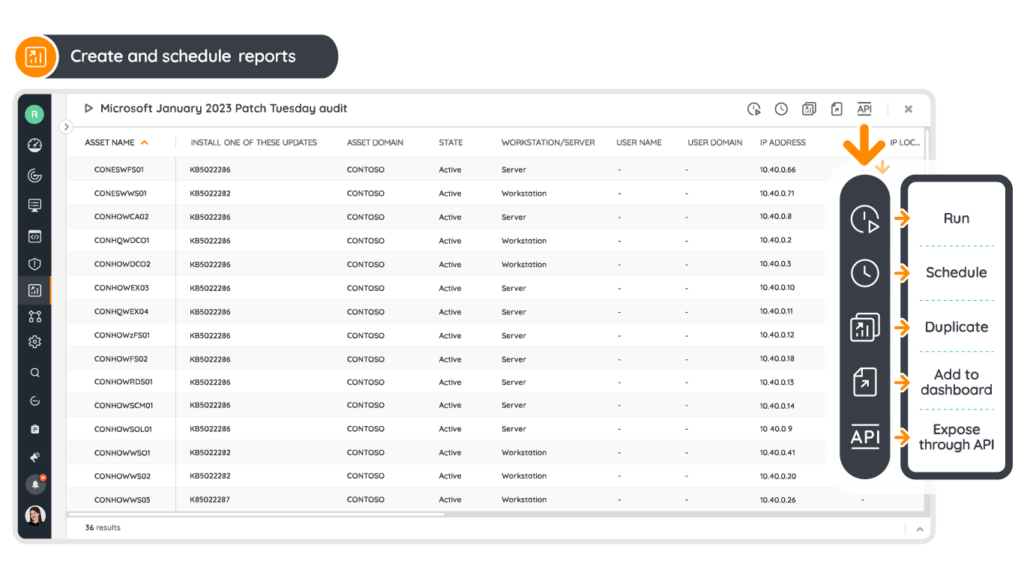
Ask any question about your technology estate and find the answer through an intuitive report builder.
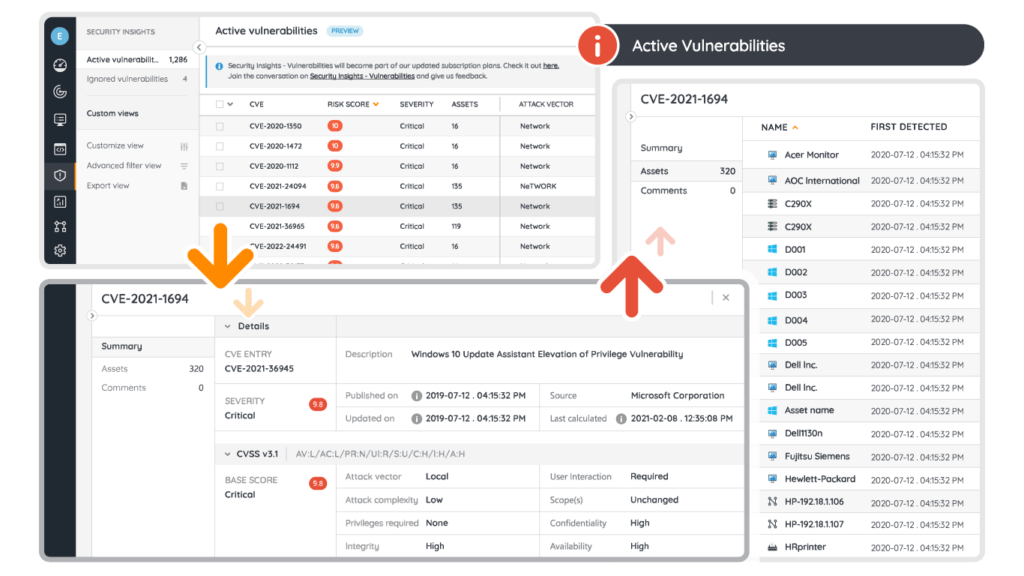
Leverage information from the NIST catalog to prioritize risks and protect your assets from known vulnerabilities.
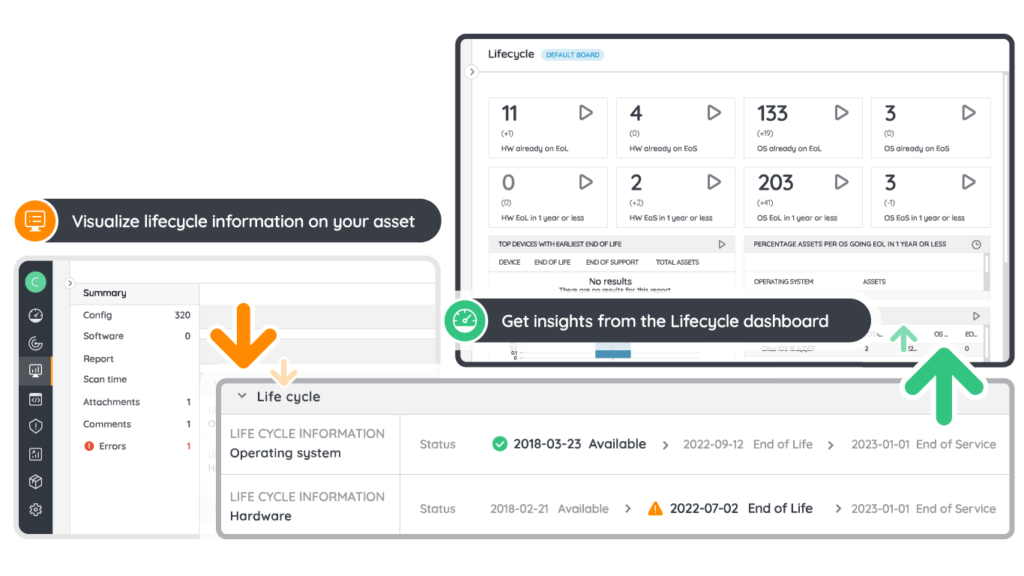
Find which of your software and assets are or will reach end of life.
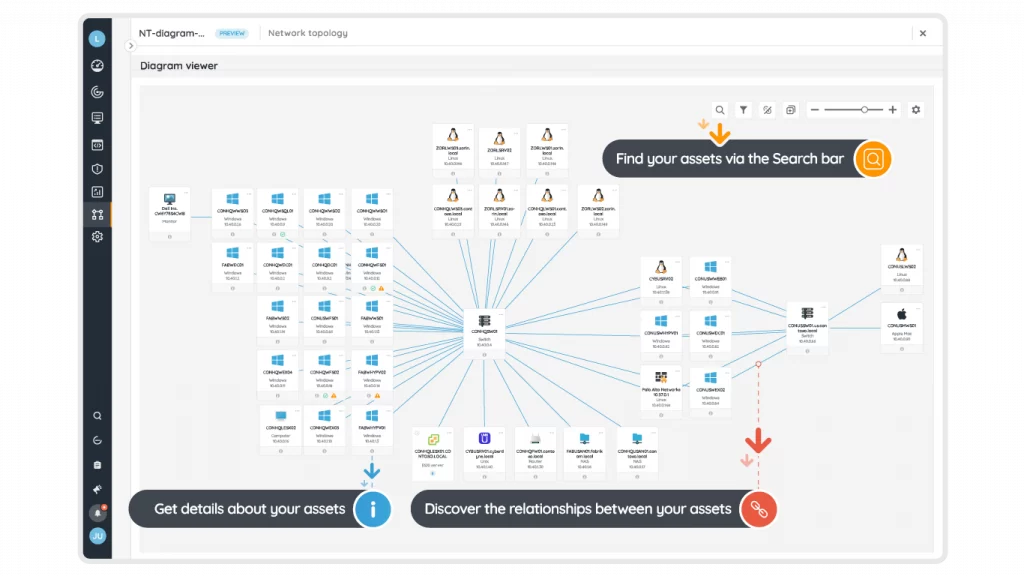
Visualize your assets, software, and users to see the trees through the forest. Generate network topologies, cloud architectures, AD structures, and much more.
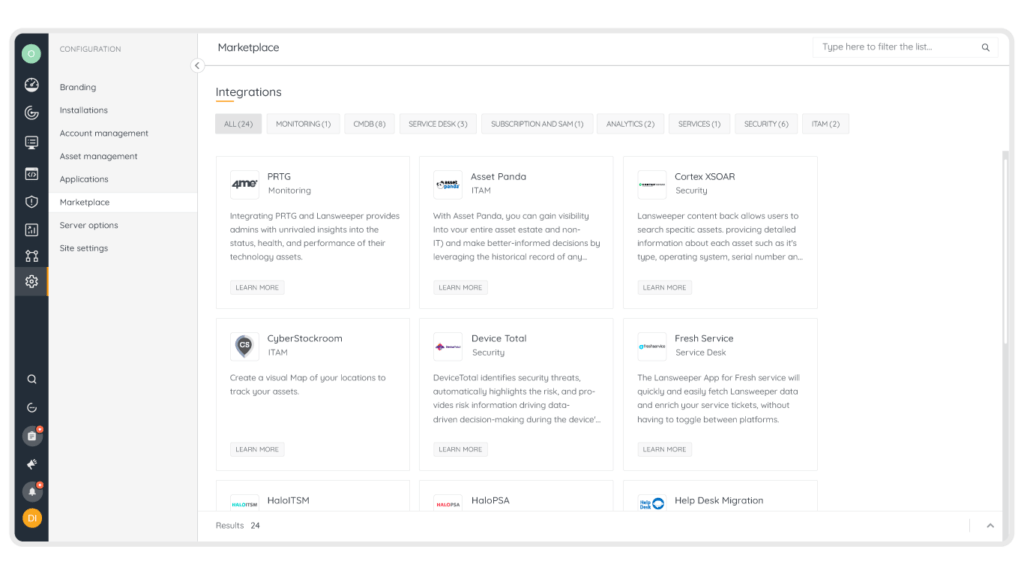
Take action and support extensive use cases through API integrations. Integrate Lansweeper with your other tools and systems through certified plug and play integrations.
IT Asset Management
Analyze And Report On Valuable Insights. Over 400 Built-In Network Reports Available.
30%
of all organizations are in a “chaotic” state, meaning they do not know what they own, where the assets are located or who is using them.
70%
of organizations have a 30% discrepancy between planned and actual inventory.
Keeping a clear oversight of your IT network can be challenging. A reliable network inventory helps to keep track of all devices that are connected to it, but it is still a massive amount of information to comb through. Diagrams present you with a clear, visual representation of your IT estate, its connections, groupings, and dependencies, like a network map. They help you to quickly understand your network and the relationships between your assets. An easy-to-read map of your network is valuable in numerous IT scenarios, ranging from configuration and performance management to troubleshooting network problems, from maintenance to creating network documentation.
Thanks to the clear insights you gain from your customizable network diagram, you can make sure everything is configured the way you want. They allow you to easily spot misconfigurations, ghost assets, and isolated assets. Moreover, they help you assess the impact of any issues by showing you how your assets are connected and how a single affected device can impact the rest of your IT estate. The same goes for any possible vulnerabilities, so you can more accurately perform risk assessments and, if needed, isolate assets.
Lansweeper allows you to generate network topology diagrams based on the rich IT asset data it retrieves. These diagrams show you asset relationships and logical groupings such as locations, virtual machines, and other common properties, but they can also be filtered by IP address, asset state, and asset type and are searchable to quickly see the data you need. Moreover, all diagrams can be exported to support your decision-making and future planning.
testimonials
The time and cost savings we realize from using Lansweeper to collect and consolidate all of the IT asset data across all our properties is substantial. We gain unprecedented insights that will help us optimize IT spend and performance across the enterprise.

Manager IT Field Services EMEA, Radisson
Compared with other solutions we evaluated, Lansweeper provided the widest coverage across all types of devices. The speed of deployment and immediate ROI was impressive. Lansweeper has helped us reign in asset sprawl across our infrastructure.

Director, World Wide IT Infrastructure and SaaS Operations, Imprivata