Pro Tips with Esben #4
Switches are crucial in any organization to ensure that everything is connected and also need careful management. Having an accurate view of which ports on your switches are available, used and what speed they have is important for any future planning and management.
Creating a Switch Dashboard
To help you get a good overview, dashboards are perfectly fitted to provide an easier method of looking at data. Instead of looking at reports or pages one by one, you can combine it all on a single page just like the example below which you can create with the resources in this blog post. To create a new dashboard, you can use the “Add New Tab” button while on an existing Dashboard.
Ethernet Ports Overview
Lansweeper scans switches and routers along with their interface details by default. Getting an overview of your switches’ and routers’ ports isn’t that difficult as you can easily browse to your asset pages and view the ports there. Unfortunately, the database structure for ports is much more complicated. To help you get an overview of the status of your switches’ or routers’ Ethernet ports, there is a specialized report that is color-coded. To add this to your dashboard, use the “Data report” widget. You can manually set the size of the widget to reduce scrolling.
Chart Port Information
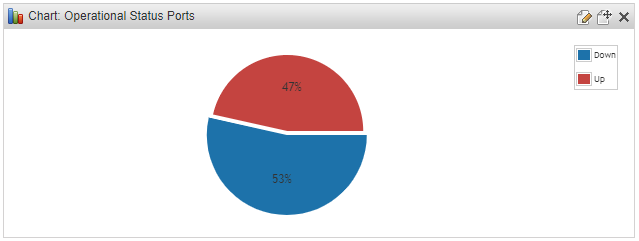
A big part of why dashboards are more convenient is because it allows you to add charts. These give you a much better overview of the current state of data than classic reports. For this dashboard, I have created four new charts.
- Operational Status Switch Ports
- Admin Status Switch Ports
- Port Speed
- Ports Used by Assets
Simply add the “Chart report” widget multiple times and select the chart reports you can find below.
Alert Reports
Alert reports are similar to charts, they provide you with a quick view of data but are focused more on identifying data that might require your attention.
The “Alerts Reports” widget can be customized on the ConfigurationReport Options page. There you can add a new page for your switch alert reports and add the reports you’ve added to your installation.
I have created 3 alert reports for the Alert reports widget.
- Switches/Routers Down (High priority)
- Switch Port Operational Status Down (Informational)
- Switch Port Admin Status Down (Informational)
Once completed, your dashboard should look similar to the original example. Of course, this is just the beginning, if you’ve got widgets or ideas of things you would like to see on this dashboard, you can share it with the community where there are plenty of experts to help you get it working.

