Introducing Lansweeper’s 2024 Summer Launch
Gain Deeper Insights, Maximize Performance
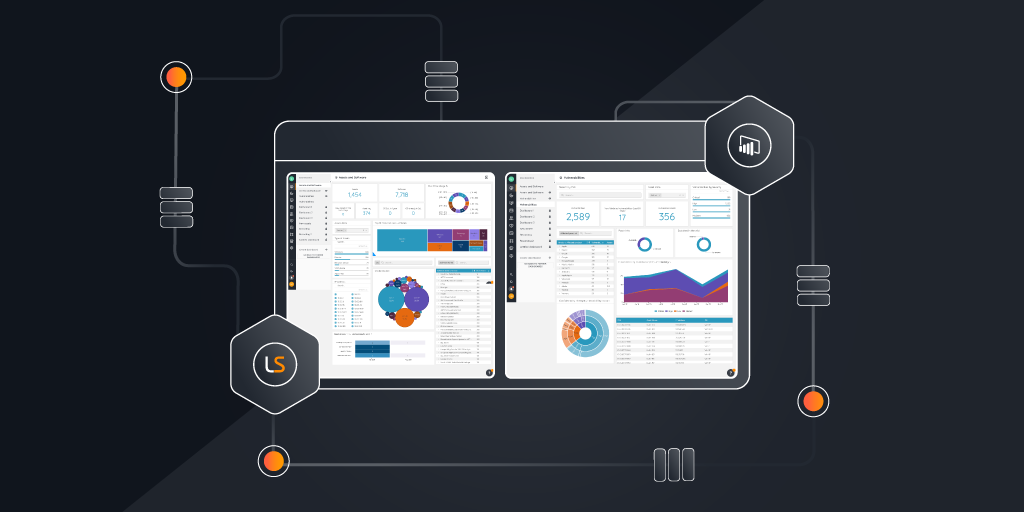
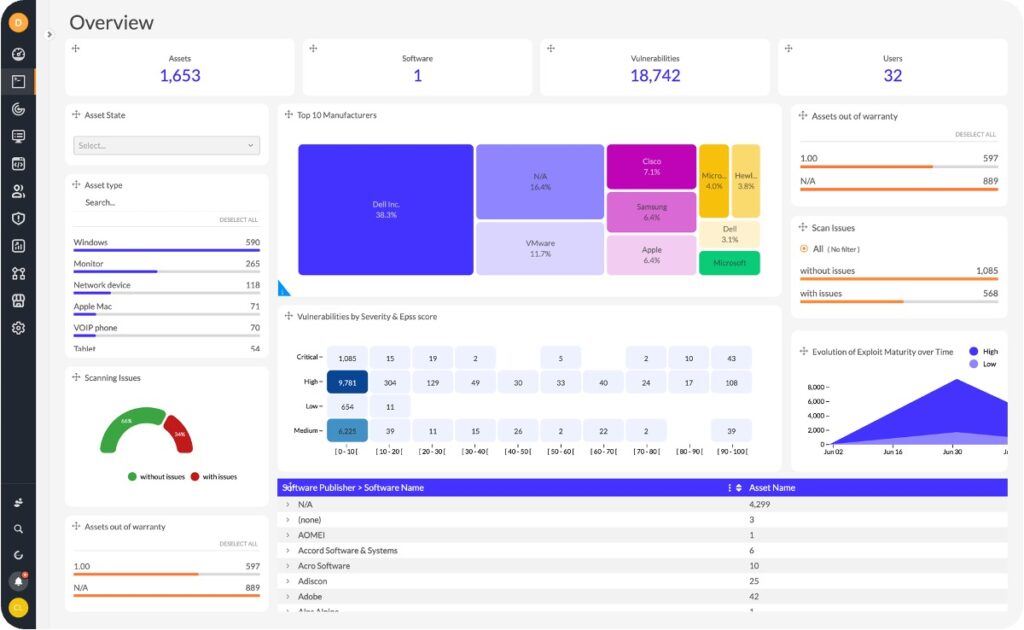
The Lansweeper Dashboard is without a doubt one of Lansweeper’s most central features. It is your window into your IT asset data, providing you with easy-to-interpret and actionable insight into the wealth of data in your inventory. That’s why we are so excited to introduce our next-generation, BI-powered dashboard, going into preview this 2024 Fall Launch. This upgraded tool is more than just a facelift—it’s a leap forward in how you visualize, interact with, and utilize your IT asset data. In this blog, we’ll explore the exciting new capabilities of our new dashboard and how it will help you and your stakeholders make better data-driven decisions.
A Next-Level Data Visualization Experience
The Lansweeper dashboard has always done what you need a dashboard to do: gather the IT asset data you have discovered into a single-pane view for asset management, cybersecurity metrics, and hardware or software overviews – all through a series of widgets you could use to customize the dashboard as you saw fit.
It is a solid foundation to build on when designing the new dashboard experience. On top of the classic dashboard to view your data, the new BI-powered dashboard introduces a host of new tools to enhance your visualization options and increase interactivity.
What’s New on Your Dashboard?
1. A New User Interface: Intuitive and Customizable
The old dashboard already has good options for customization thanks to a wide array of widgets to choose from, but these widgets, as well as the layouts, are still predefined and have their limitations. The new dashboard is not only visually appealing but also, truly, fully customizable with resizable drag-and-drop widgets in a design that prioritizes intuitiveness. This makes it easier than ever to gain insights at a glance.
2. Advanced Data Visualization
The current Lansweeper dashboard offers visualization through a set of predefined widgets, somewhat restricting your visualization options. On the new dashboard on the other hand, while it still uses widgets, they are highly versatile and customizable resulting in a more dynamic and interactive experience providing deeper insights into your data.
3. BI Integration
The Lansweeper dashboard was always focused mostly on IT metrics. The new BI overlay takes it a step further, taking the dashboard from a simple visualization tool to an advanced analytics platform. Thanks to the new BI capabilities you can uncover trends, spot anomalies, draw connections across different data points, and use advanced filtering to really drill down for targeted insights into the data that matters the most.
4. Widget Alerts
Up until now, to get the newest insights from your dashboards, you would need to manually check for updates. Alerts have always been available in Lansweeper, but only for reports and event logs. In the new dashboard, each individual widget supports custom alerts that will notify you via email, SMS, Slack, or webhook. This way you can set alerts for any critical metrics appearing on your dashboards, ensuring a swift response.
What this New Dashboard Experience Means for You
New features and functionality always look great, but what does it mean for your dashboard experience?
Empowering Data-Driven Decisions
When talking about dashboards and analytics, the first benefit that comes to mind is always better data-driven decisions. The new dashboard provides better and deeper insights to support decision-makers on all levels. Build your custom dashboard to display metrics relevant to specific audiences. Whether you are tracking KPIs, managing incidents, or monitoring system performance, thanks to the new dashboard you can draw insights from always-accurate data faster and more effectively.
Increased Flexibility and Personalization
The new dashboard provides a higher level of flexibility and personalization than before, allowing each user to tailor their view to fit their needs. This is invaluable for dashboards that are visited by diverse users, with diverse data needs. IT managers do not always need the same data as your security analyst. Custom dashboards for different users allow everyone to draw the insights they need for their tasks from your data quickly and efficiently. Flexible layouts and a wide array of widget options allow you to shape the dashboard to fit each user’s requirements.
Dashboard Alerts and Proactive Management
The new dashboard’s widget alerts are a game-changer for proactive IT management. You no longer need to wait for an incident to set off alarm bells, nor constantly monitor your metrics. Simply set your widget alerts to your custom threshold and let Lansweeper notify you when a critical event occurs, whether it’s an unusual log-on or a server nearing the limit of its capacity. These real-time alerts allow you to proactively address potential issues before they can escalate into a problem, preventing costly downtime and disruptions.
Advanced Collaboration and Data Sharing
Customize, save, and share your dashboards for better cross-team collaboration. You can even export your insights in various formats like Excel, CVS, or PNG for even easier data sharing with your stakeholders. By sharing your dashboards and their insights across departments you can bridge the gap between IT and business teams for a better alignment on strategic goals.
Transitioning to the New Dashboard
The new dashboard is available in preview as of the 2024 Fall Launch on November 19th. If you want to transition to this new dashboard experience there is a simple, yet in-depth onboarding process that will guide you through the changes. This ensures users can maximize the dashboard’s capabilities from day one.
Driving Value Through Data
The new dashboard is the next step forward in our mission to bring you the greatest depth and width of data insights possible. With the addition of advanced customization, real-time alerting, and business intelligence, the new dashboard transforms your raw data into actionable insights that drive informed decision-making. It is more than just a reporting tool; it is your window into your technology environment that fosters proactive IT management, efficient resource allocation, and strategic planning across the organization.
Ready to get started? You’ll be up and running in no time.
Explore all our features, free for 14 days. No credit card required.
