IT Dashboard: The Best Overview
Centralize & Consult Your Data in 1 IT Dashboard
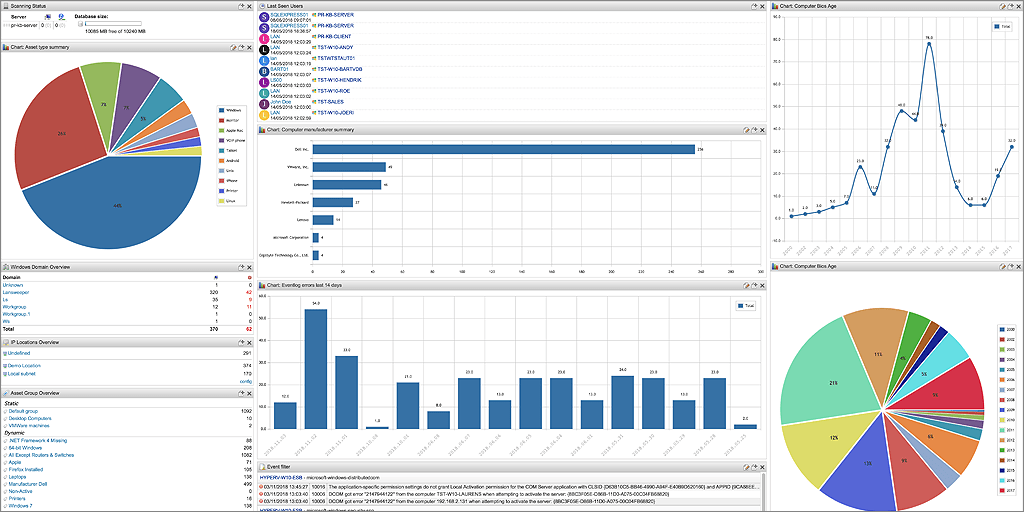
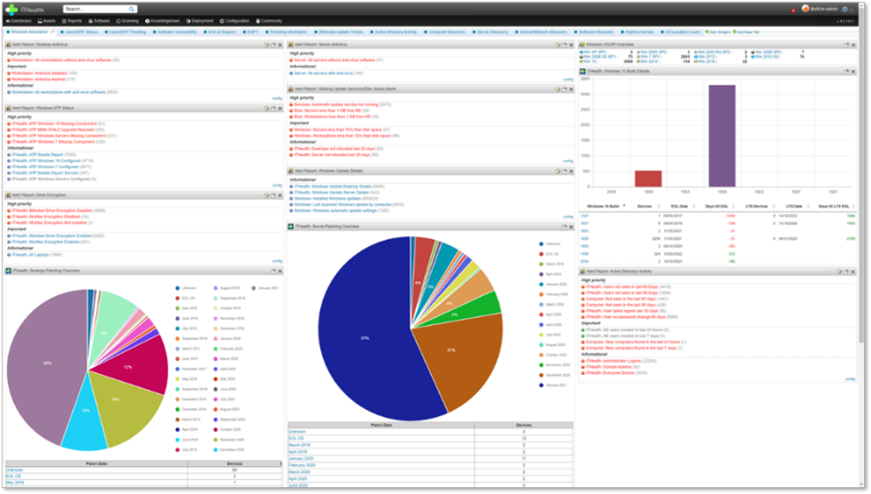
When you want to manage an IT estate, you first need to effectively gather all your data, wherever it is. But just gathering the data is not enough to easily manage your IT. You need a solution that centralizes your data and facilitates you in consulting it. Lansweeper’s scanning algorithm collects a massive amount of information and stores it in a secure and centralized database. With the Lansweeper IT Dashboard you can browse and select all relevant data about your IT environment and gather it in a customized overview dashboard. It is a quick and easy way to organize your key metrics and KPIs. You simply drag and drop the widgets that are useful to you to create a quick dashboard.

Lansweeper offers many ways to organize and analyze the wide array of information it gathers about your network. On the IT Dashboard, you can visualize data by creating multiple visual overviews, for example for specific use cases like hardware, software, cyber security, or vulnerabilities. You can use a wide array of widgets to create charts, tables, data reports and more. Moreover, it is possible to integrate external applications using the iframe window. You will no longer have to navigate different pages to compare results. Now you can go over everything you need to know instantly on your customized overview dashboard. And if you like, you can create structure simply by adding tabs.

After you have spent some time creating the perfect IT dashboard, it is nice to be able to share your work with your colleagues. You can share dashboards with users with asset management rights. This way, anyone can benefit from your customized overview dashboard. In addition, if you want to share important messages or updates across the network, you can do so by creating global tabs.

Do you want to explain something to colleagues from a different department or do you have to give a presentation to your superiors? You can use the IT Dashboard to visualize data according to the needs of your audience. A C-level audience wants to know if KPIs are being met, while a colleague with little technical expertise might need a simplified display. Using the IT Dashboard, you can easily adapt your customized overview dashboard or generate a quick dashboard according to your wishes.
Entdecken Sie alle unsere Funktionen, 14 Tage lang kostenlos.