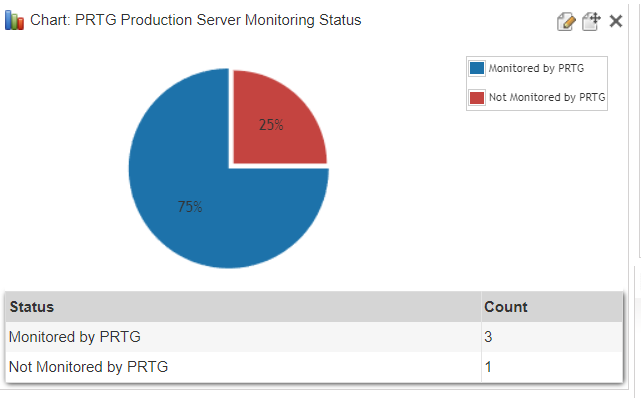
PRTG Production Server Monitoring Status Chart
Chart MiscellaneousList Windows Servers and Their Custom Fields
Report on custom data you’ve entered Lansweeper and gained additional insights by utilizing custom fields to store additional asset data that helps improve classification like the environment of your assets, the contact person, Application Family or even PRTG Status. Regardless of what data you add in your custom fields, you can adjust this report to create a chart for it. You can read all about this use case and how to improve your asset classification in the Pro Tips 48 blog post.
- To use this in a chart widget, prefix the report name with «Chart:» and select it in the chart report widget found on a dashboard.
The custom field numbers and names might need to be adjusted depending on your setup.

PRTG Production Server Monitoring Lansweeper On-Prem Query
Select Top 1000000 Status = 'Monitored by PRTG',
Count(countbackedup.AssetID) As Count
From (Select Top 1000000 tblAssets.AssetID
From tblComputersystem
Inner Join tblAssets On tblComputersystem.AssetID = tblAssets.AssetID
Inner Join tblAssetCustom On tblAssets.AssetID = tblAssetCustom.AssetID
Where tblAssetCustom.Custom1 = 'Yes'
And tblAssetCustom.Custom2 = 'Production' And
tblComputersystem.Domainrole > 1 And tblAssetCustom.State = 1
Order By tblAssets.AssetName) As countbackedup
Union
Select Top 1000000 Status = 'Not Monitored by PRTG',
Count(countnotbackedup.AssetID) As Count
From (Select Top 1000000 tblAssets.AssetID
From tblComputersystem
Inner Join tblAssets On tblComputersystem.AssetID = tblAssets.AssetID
Inner Join tblAssetCustom On tblAssets.AssetID = tblAssetCustom.AssetID
Where tblAssetCustom.Custom1 <> 'Yes'
And tblAssetCustom.Custom2 = 'Production' And
tblComputersystem.Domainrole > 1 And tblAssetCustom.State = 1
Order By tblAssets.AssetName) As countnotbackedup