Pro Tips #58
Ever since we introduced our Patch Tuesday audits in 2017 after WannaCry, the format has stayed relatively similar. I’ve done some modifications over the years based on your feedback, but generally speaking the mechanics of how the report worked always stayed identical. However, Windows version management has not. Today I’ll dig a little bit into the new and improved Patch Tuesday audit the why, how and some extra reports you can use during your monthly audit.
But Why?
The first thing many people asked when I started re-engineering the report was why? Why fix something that isn’t broken? Well, it was broken in some ways, but to showcase that I have to go back to how Patch Tuesday used to work.
The old Patch Tuesday was pretty simple. You take all of the new patch numbers Microsoft releases (KB…….) and simply report on devices that do not have any those patch numbers scanned. Another important piece of information is that Windows patches are cumulative, meaning the latest patch also includes all of the previous ones.
Issue #1
Back to what was broken, having a static list of patches from a single month, causes significant challenges for organizations that have slower change management processes or deployment rings as soon as Microsoft releases any new update, the old report could instantly start providing false positives because devices can skip the specific patch number the report is looking for in favor of a more recent patch.
Issue #2
Microsoft sometimes has “happy accidents” with Patch Tuesday updates. This forces them to release new updates a few days later or halfway through the month. Sometimes, critical issues are detected for which Microsoft pushed a mid-month update. In both of these scenarios, the old report could, similarly to issue #1, cause false negatives due to devices skipping a specific update in favor of a more recent one.
Issue #3
Newly deployed devices will not have a update history. Therefore there will be no way to check to which degree they are up-to-date with the old Patch Tuesday reports.
The Improved Patch Tuesday
The improved Patch Tuesday report aimed to solve these issues and while that might sound easy to do a number of challenges came up during the long process of finding a solution.
Challenge #1
Microsoft’s patch numbers is inconsistent. I presume that patch numbers are assigned based on Microsoft’s internal development process starts. As such, a mid month emergency patch often has a higher patch number than the following month’s Patch Tuesdays patches.
This means that the patch numbers cannot be used as a comparative value to for example check of a device has a patch higher than number 1234567.
Challenge #2
Builds were only introduced in Windows 10 and Server 2016, at least as a scannable item from the Windows WMI. This means that within Lansweeper, we only have build information starting from Windows 10 and Server 2016.
The Solution
The solution is a hybrid approach. For Server 2012, the new Patch Tuesday report uses the old method, looking for a specific patches. For anything newer, the report looks at builds. This significantly improves the accuracy of the report.
Since builds only get applied after a required reboot, the report now also takes this into account and prevents false positive scenarios where a patch might be installed, but not applied yet by a reboot.
Additional Improvements
During the re-engineering I came across multiple items that could improve the reports. As for now these additions are only available on-premises since these rely on complex data manipulations or data not available in Lansweeper Sites.
Highest Patch Installed
The first addition is a more informational field, the highest patch installed fields, as the name suggests, simply shows the highest patch number found in the asset’s update history. As described in the first challenge this isn’t 100% the same as the most recent patch.
Installed On
The second new addition is also more informational and provides the most recent date a patch was installed taken from the update history.
Reboot Status
The third new addition is the reboot status of a device. Since devices often must be rebooted in order for the build number to increase after an update. This information is crucial context.
There are a multitude of indicators on the Windows OS which show whether a reboot is required or not. However during my research I found that in order to get accurate information on this, it would require checking 10 or so different registry keys. Since I want to keep this report simple to run and require no configuration. I took a different approach.
Lansweeper scans the event log specifically for device power related events. It uses this info for calculating uptime, but we can also use it to determine when the last reboot was. By checking if a reboot took place after a patch was installed, we can determine whether a reboot is required or not.
Patch Tuesday Charts
Another thing I’ve seen from the community is a request for charts, a higher level overview of the Patch Tuesday status. So I’ll also show below how you can make two different charts for your Lansweeper on-prem.
To create these charts, you can always start from the Patch Tuesday report we provide every month. While there will be some unnecessary code left in the report after you adjust it, none of it will actually impact the accuracy.
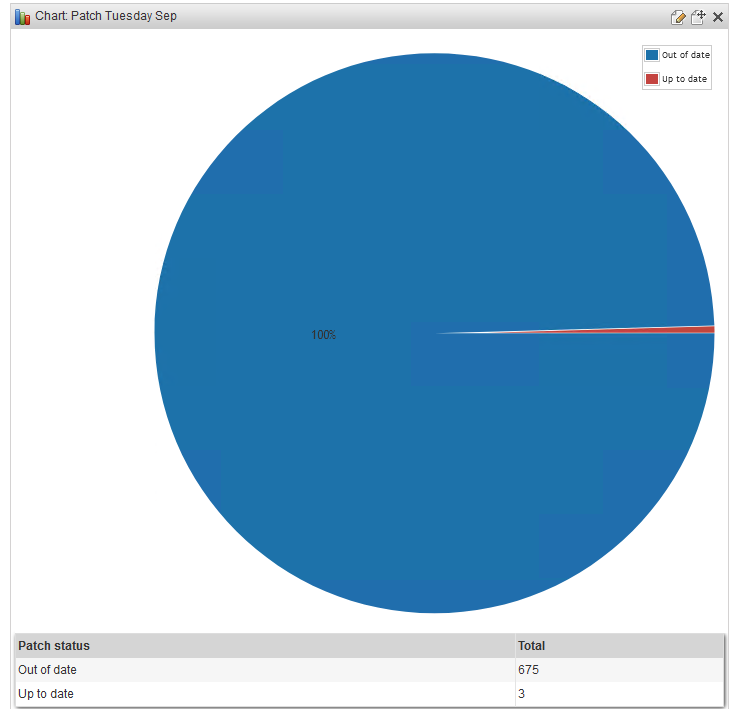
Patch Status Chart
The first chart is simply an overview of the number of assets that are or are not up-to-date.
Every Patch Tuesday report starts with a “Select“ statement which ends with “From tblAssets«. Everything in between can be removed and replaced with the following:
Select
SubQuery4.[Patch status],
Count (distinct tblAssets.AssetID) As Total
From tblAssets
At the bottom of the monthly Patch Tuesday report you’ll find the following code:
Order By tblAssets.Domain,
tblAssets.AssetName
This can be replaced with:
Group By SubQuery4.[Patch status]
Order By Total Desc
Don’t forget to save the report with the prefix “Chart:” in the name to be able to use it in your dashboards.
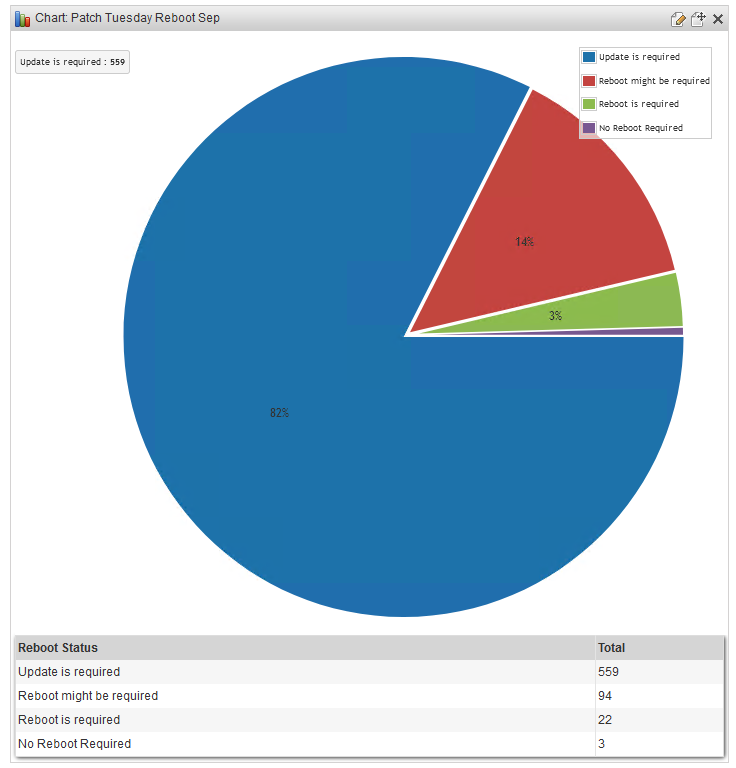
Reboot Status Chart
We can do something for the reboot status and create a chart that shows us how many devices still need a reboot.
To start, similar to the previous chart, replace everything from “Select“ to “From tblAssets» with the following:
Select
CASE
WHEN SubQuery4.[Patch status] = 'Up to date'
THEN 'No Reboot Required'
WHEN CONVERT(date, LatestEvent.EventTime) = CONVERT(date, SubQuery1.InstalledOn)
THEN 'Reboot might be required'
WHEN CONVERT(date, LatestEvent.EventTime) < CONVERT(date, SubQuery1.InstalledOn)
THEN 'Reboot is required'
ELSE 'Update is required'
END AS [Reboot Status],
Count (distinct tblAssets.AssetID) As Total
From tblAssets
At the end of the Patch Tuesday report, replace this:
Order By tblAssets.Domain,
tblAssets.AssetName
With this:
GROUP BY CASE
WHEN SubQuery4.[Patch status] = 'Up to date' THEN 'No Reboot Required'
WHEN CONVERT(date, LatestEvent.EventTime) = CONVERT(date, SubQuery1.InstalledOn) THEN 'Reboot might be required'
WHEN CONVERT(date, LatestEvent.EventTime) < CONVERT(date, SubQuery1.InstalledOn) THEN 'Reboot is required'
ELSE 'Update is required'
END
ORDER BY Total DESC
Again, don’t forget to save the report with the prefix “Chart:” in the name to be able to use it in your dashboards.
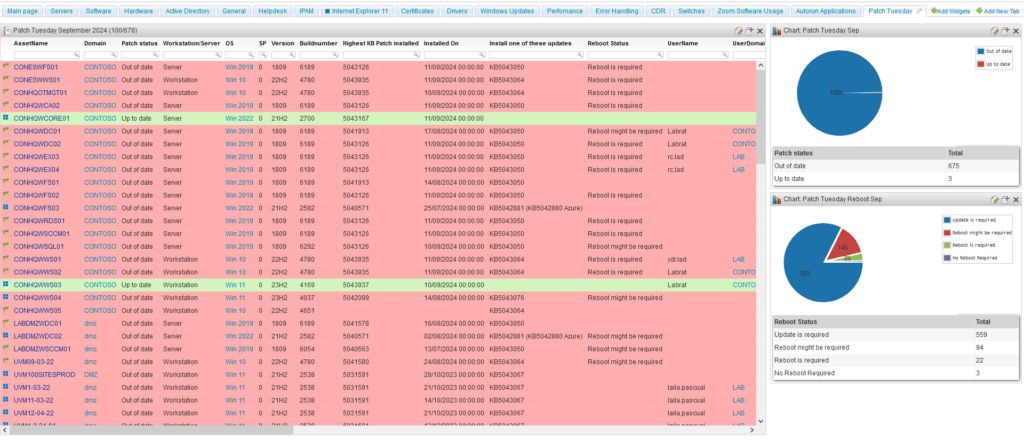
Combining all of this together in a dashboard gives you a better overview of your patch Tuesday deployment progress.