Pro Tips with Esben #6
From IP addresses to subnets and DNS/DHCP settings, Lansweeper has a lot of data that can be used for IP address management. While Lansweeper does not have a dedicated IPAM feature, with the detailed information Lansweeper has we can create reports, charts and more to do basic IP address management.
Configuring Lansweeper
One of the foundational data points for IPAM is having an overview of your subnets, their capacity, how much of that capacity is being used and who is responsible for a specific subnet or the contact person.
The first step of visualizing this is making sure that all the data is in Lansweeper. If you’ve got outdated or incomplete data, you might have multiple devices with the same IP address which will affect your overall reporting.
The second step consists of checking that any old deprecated devices still lingering in your Lansweeper installation do not have the “Active“ state. The reports and charts use active devices to calculate the usage of your subnets. If you need help with this, the “Creating, using and changing asset states” knowledgebase article is a great resource.
The last step consists of adding all the subnets you want an overview of to your Scanning Targets as an IP Range. If you don’t scan using an IP Range, you can also just disable the IP Range target while adding it. Additionally, you can use the Description of the IP Range for additional information about the subnet like the contact person.

Visualize IP Capacity and Usage
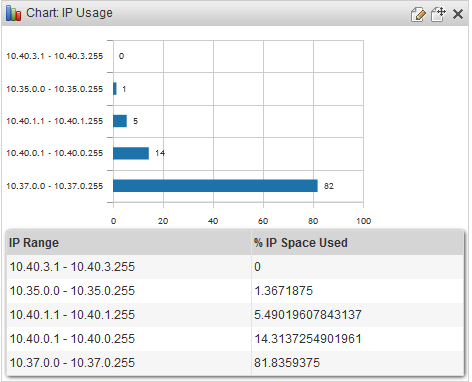
Now that we have the configuration done, we’ll move on to part two using the reports and charts. Let’s start with the reports. The first report provides an overview of each IP Range you entered in your scanning targets along with the size of the IP Range, how many assets have been found with an IP in that range, and how many IPs are still available. Because these numbers are based on the IP addresses linked to your assets, having multiple assets with an identical IP address can skew the numbers, so just be aware of that.

If you’d like to look at the details of the assets used, I’ve made a report that shows all the assets, their IP, the IP Range they are a part of, and more so if you’ve got some strange numbers, like over 100% IP usage, you can easily look for the cause.

The final two are Chart reports, one chart to visualize the IP usage percentage of all your IP Ranges, and the second one to visualize the size of your IP Ranges.
DNS and DHCP Data
If you’re interested in DNS and DHCP-related data, you can find Windows DNS and DHCP settings in the following custom and built-in reports. Additionally, if you’re looking into building your own report for DNS and DHCP Windows information, TblNetwork is the table where you can find all the info.
Custom Reports
Built-in Reports
- Network: No DNS server specified
- Network: Only one DNS server specified
- Services: DNS client service not running
- Services: Microsoft DNS server installed
- Network: Static IP address configured
- Services: Microsoft DHCP server installed
